Airbnb User Behavior Classification

Table of Contents
1. Project Overview
2. Tools Used
3. Data Distribution
4. Phase 1, Multivariate Classification Models
5. Phase 2, Binary Classification Model
6. Phase 2, Establish Threshold
7. Final Results
8. Flask App
9. Github Repo - Link
1. Project Overview
The goal of this project was to Classify new AirBnB users as to their destination preference solely based on online activity and static user data.
- Static User Data such as:
- Device Used
- Signup Method
- Age
- Dynamic User Data (Sessions) :
- Active Session Time
- Buttons Clicked
- Active Browser type
- 10 Million User activity data points were used for the analysis.
- A total of 190 Features were generated using these data points.
Project Broken Down into two Phases:
- Multiclass Classification
- Binary Classification
2. Tools Used
Sklearn, Postgres SQL, Flask, Plotly, D3, Python, Pandas, Matplotlib and Seaborn, Jupyter Notebook, HTML, CSS,.
3. Algorithms used:
- Logistic Regression
- KNN
- SVM (Support Vector Machines)
- Ensemble Random Forest Classifier
- Decision Tree Classifier
- Tuning: Sklearn GridSearchCV
3. Data Distribution
Exploratory Data Analysis was performed on the age distribution of the target demographic. Below is a plot created using Seaborn, represents the histogram of average AirB&B user age.
Multivariate Classification Models
Phase 1: Choosing Algorithm
Tested Initial Data using Various Models: Each Model was Cross Validated Using Test Sets. Below is the test data model summary.
 Best Performing model was Random Forest Classifier. These results were not significant due to high class imbalance.
Phase 2, Binary Classification Model
Due to high class imbalance, we were unable to get significant results from multivariate classification. In order to derive significant results from the data, I narrowed down the classes to find just users travelling in the States vs the rest of the world.
As you can see below Logistic Regression, outperformed random forest classifier by a large margin. Scoring Metric was F1 Score, with a good balance of accuracy and recall.
Listed below are the features with the highest impact on the model. R Squared of this model remained consistent with the test set, we can conclude there was no overfitting.
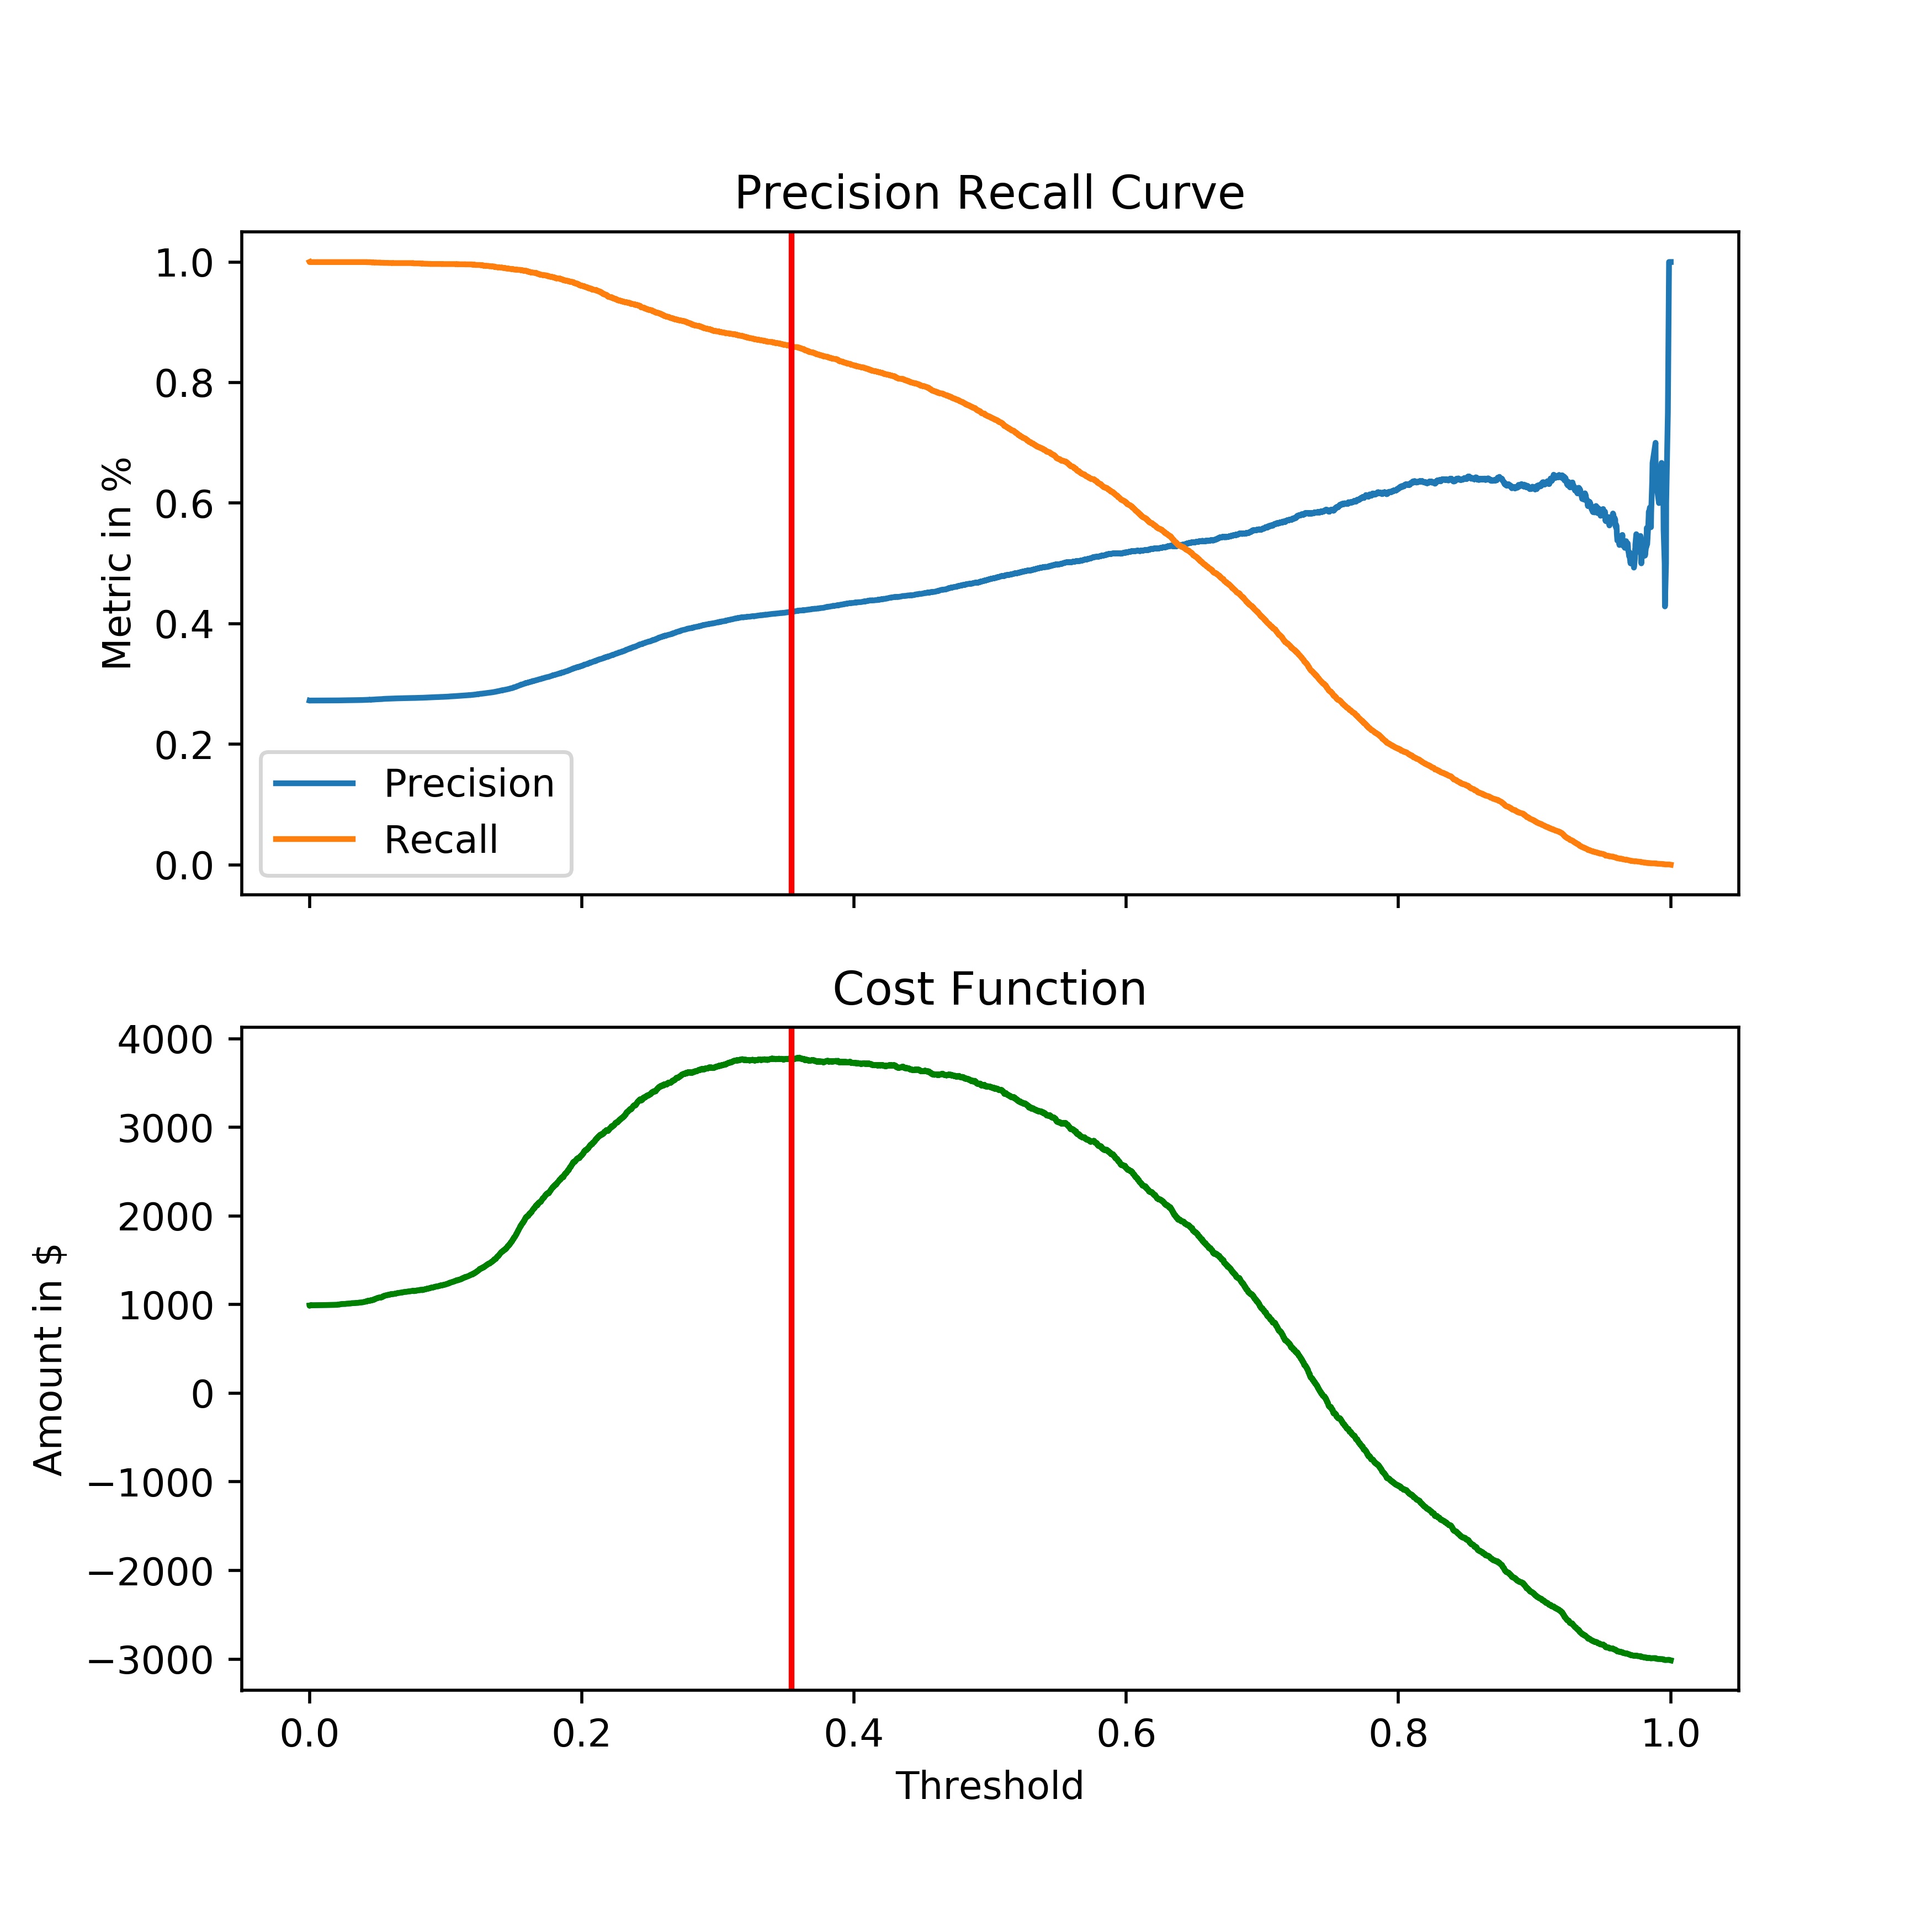
Phase 2, Establish Threshold
Challenge: Choosing the right threshold. How to determine that this is the most effective threshold?
- Solution 1, Precision Recall Curve: It helps determine a good balance between precision and recall.
- Solution 2, Create a custom Cost Function.
Testing the threshold via custom cost function:
- TP=Advertised Correctly. Gain 1.5$
- FN= Miss Opportunity. Loss 1/2$
- FP= Wrong Demographic. Loss 1/2$
- Best Threshold .35
- Profit Margin of 4,000$ with this model and threshold.
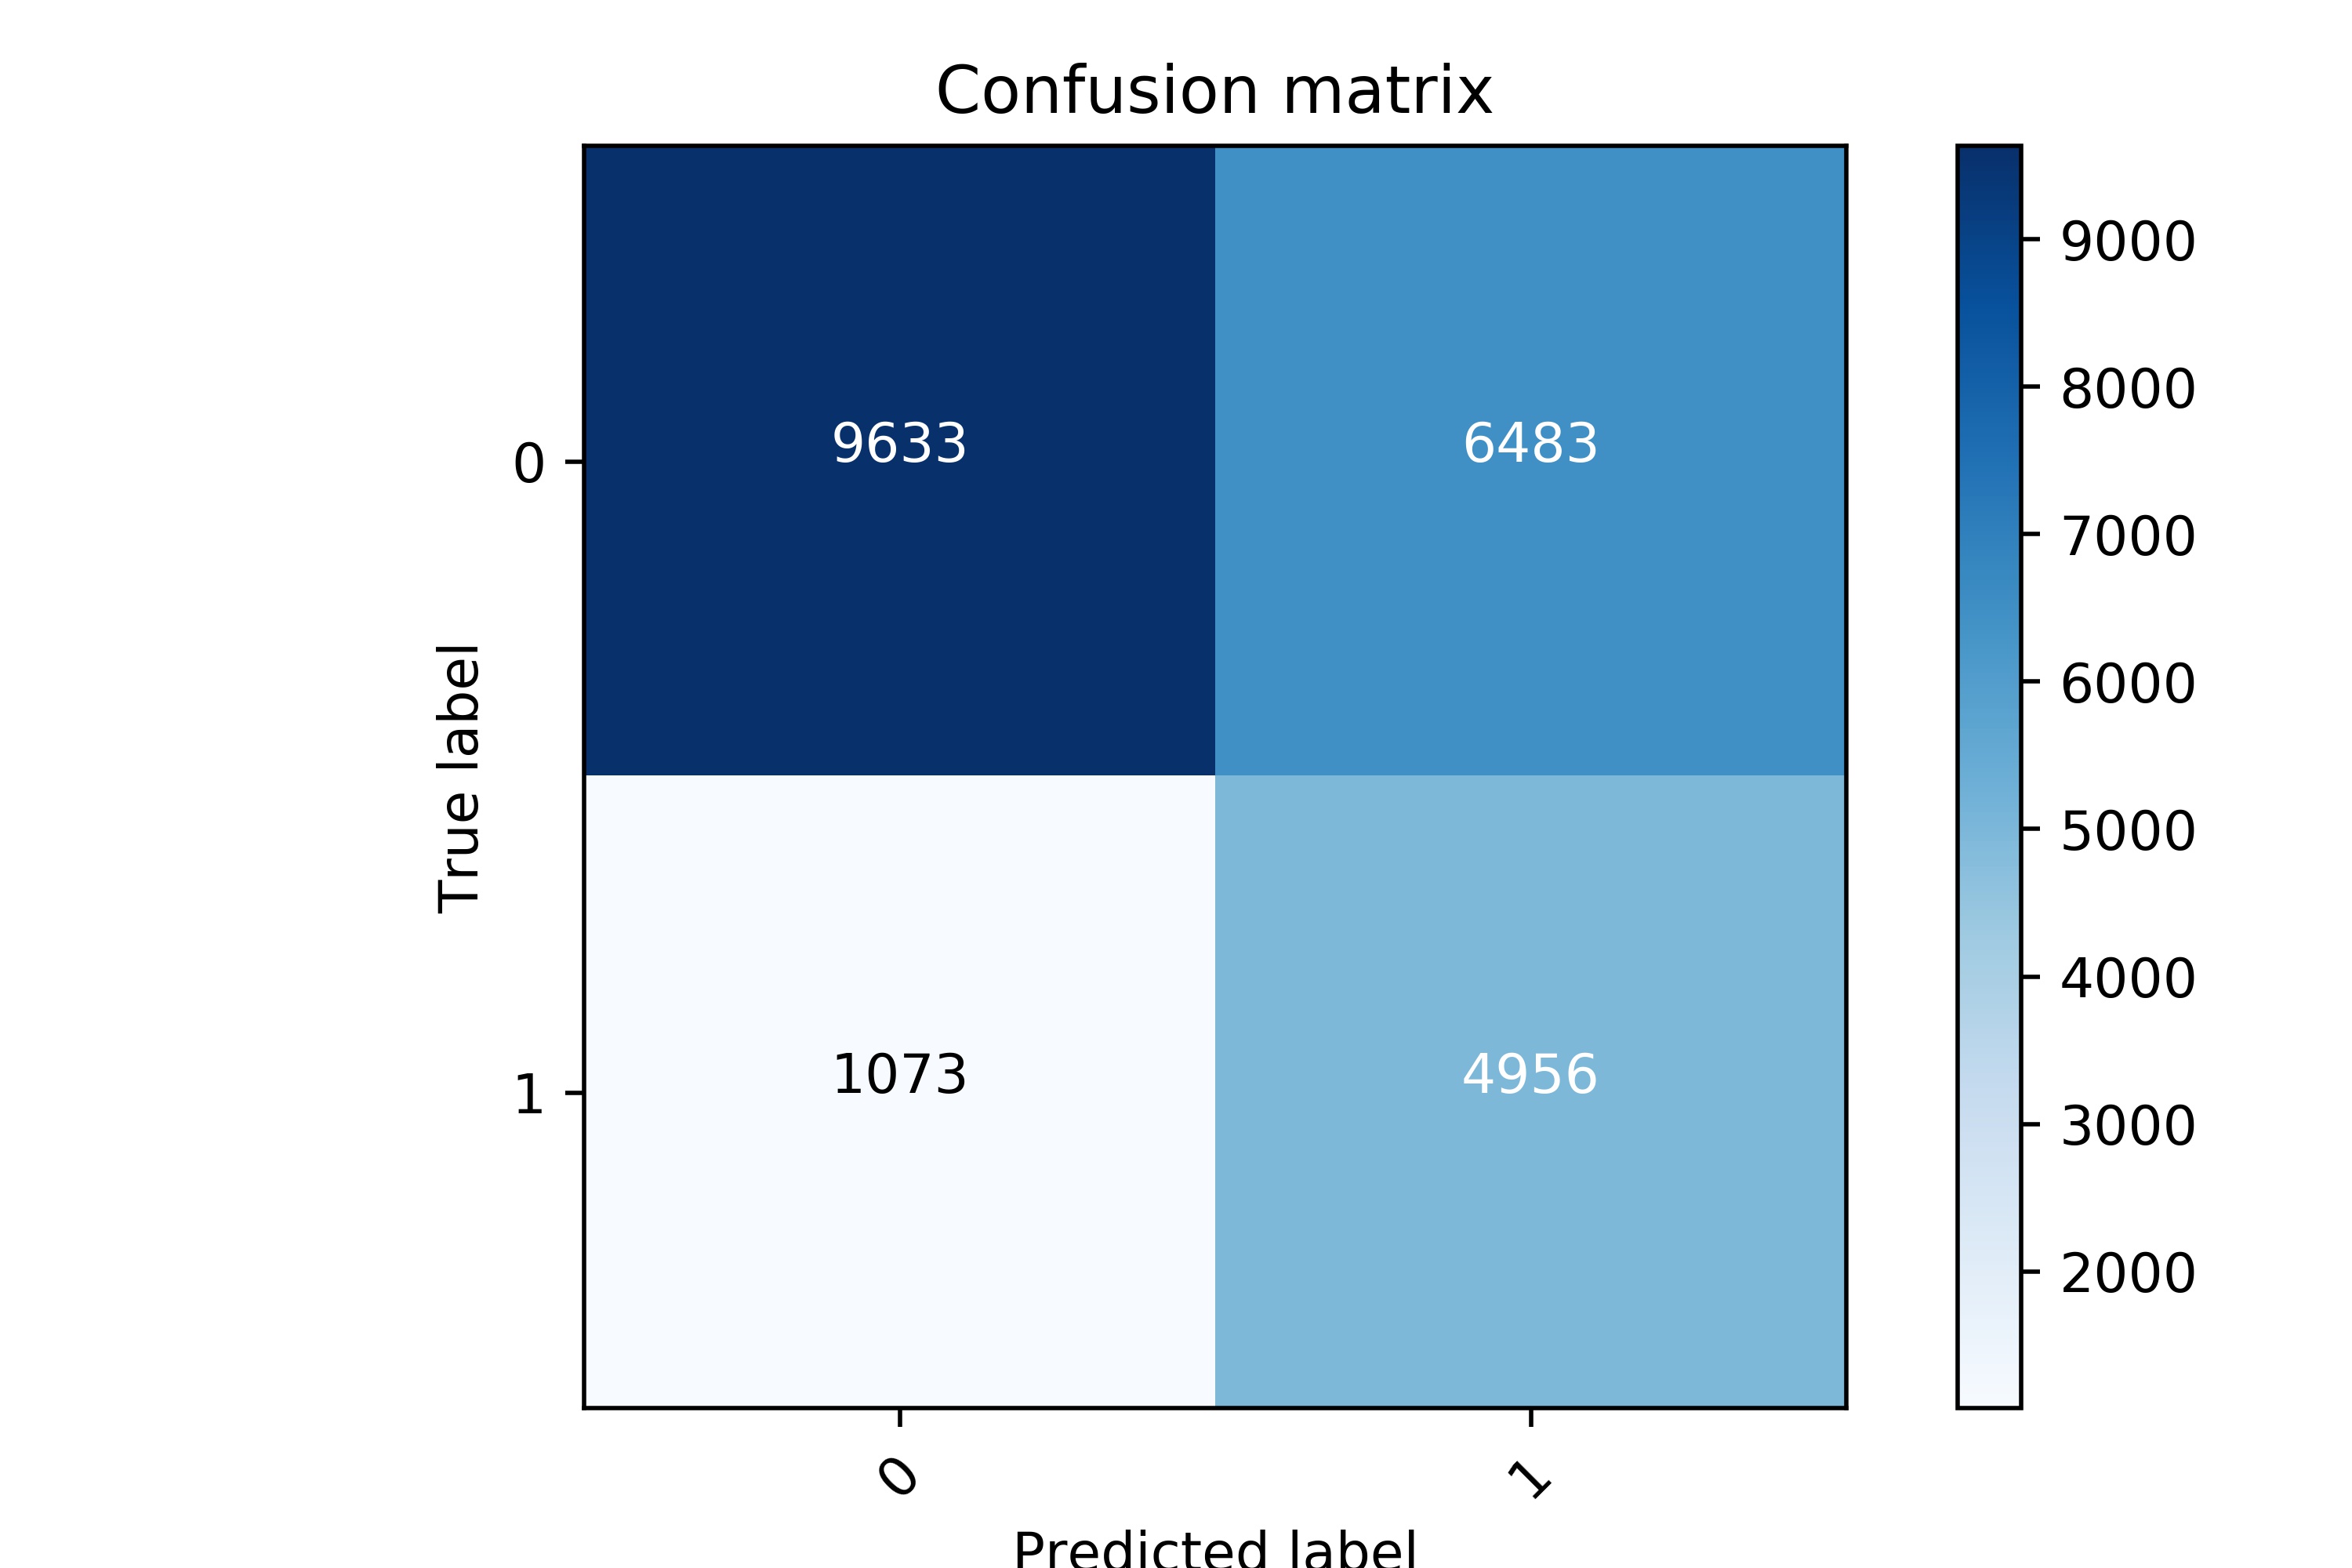
Final Results:
Best Performing model for the binary dataset was Logistic Regression. Model Accurately predicts 82% percent of us Customers, while minimizing loss on False Positives.
Details on the model below:
| Metric | Before TH | After TH |
|---|---|---|
| Recall | .74 | .82 |
| Precision | .47 | .43 |
| F1 | .58 | .57 |
App:
Contact:
Thank you for visiting the page, feel free to contact me at smeet.vikani@gmail.com